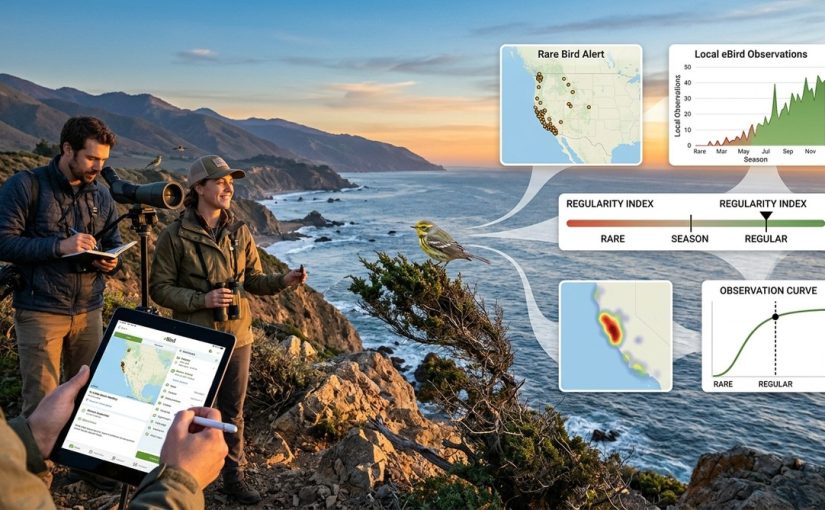
Every time a rare bird shows up in an unexpected place, a small ripple moves through the birding community. Someone posts a photo to a listserv. A county record is broken. Then the question everyone wants answered: was this a one-time wanderer, or is this species now part of the local landscape? For years, that answer was mostly guesswork. But eBird has changed the game. By analyzing eBird rare bird sightings data analysis, you can see the exact point where a rarity becomes a regular.
eBird’s massive dataset lets you track the frequency and distribution of rare bird sightings over time. By looking at reporting rates, observer effort, and geographic spread, you can spot the moment a vagrant species starts appearing consistently in a new region. This data helps birders, researchers, and conservationists understand real shifts in bird populations.
Why a Single Sighting Is Not a Trend
When a Fork-tailed Flycatcher showed up in Oregon in 2026, the news spread fast. But one bird does not make a population shift. The challenge with rare bird sightings is separating true range expansions from simple vagrancy. A bird caught in a storm system might end up hundreds of miles from home. That does not mean it belongs there.
eBird solves this problem by aggregating thousands of checklists over many years. You can compare how many times a species was reported in a region during a given period. If a bird was seen once in 2024 and then ten times in 2026, something changed. The data tells the story.
How to Read the Shift in eBird Data
You do not need to be a data scientist to see the pattern. Here is the practical process that reveals when a rare bird becomes a regular.
-
Pick a species and a region. Start with a bird that has historically been rare in your area. For example, the Brown Booby along the California coast. Use the eBird Explore Data page to pull up sightings.
-
Look at the bar chart of observations by year. eBird shows you the total number of checklists that include that species. A single bar in 2022 might be one sighting. A taller bar in 2025 might be fifteen. But raw numbers can be misleading because more birders are submitting data every year.
-
Adjust for observer effort. This is the key step. eBird provides a metric called “reports per 100 checklists” or “frequency.” This normalizes the data. If 1 out of every 100 checklists in a county includes a Brown Booby in 2022, and 5 out of every 100 include it in 2026, that is a real increase.
-
Check the seasonal spread. Rare birds often appear during migration windows. If a species starts showing up in multiple seasons, it may be establishing a pattern. A single spring record is less meaningful than records in spring, summer, and fall.
-
Map the locations. Use the eBird range maps to see if sightings are clustered in one spot or spread across a wider area. A single hotspot might be a trap site for vagrants. Multiple locations across a state suggest a broader trend.
Common Mistakes in Rare Bird Data Analysis
Even experienced birders can misinterpret eBird data. Here is a table of common pitfalls and how to avoid them.
| Mistake | Why It Happens | How to Fix It |
|---|---|---|
| Counting raw sightings without effort | More birders submit checklists each year. A rise in sightings might just mean more eyes. | Always use frequency data (reports per 100 checklists). |
| Ignoring identification errors | Rare birds are often misidentified. A report of a Slaty-backed Gull might be a more common species. | Look at the photos and comments attached to the checklist. Check for review by eBird reviewers. |
| Treating a single season as a pattern | A species might show up during one fall and then vanish for years. | Look for consistent presence across multiple years and seasons. |
| Overlooking regional bias | Some counties have many active birders. Others have few. A rare bird in a well-birded county gets reported more. | Compare regions with similar observer effort. Use the eBird “bar charts by region” tool. |
What the Data Tells Us About Vagrants in 2026
The year 2026 has already produced some surprising patterns. Consider the surge of Siberian vagrants in the Pacific Northwest. Species like the Siberian Blue Robin and the Streak-backed Oriole have appeared in places where they were previously unknown. By running the analysis described above, you can see that these are not isolated events. The frequency data shows a clear upward trend starting around 2023. Weather patterns, shifting jet streams, and habitat changes all play a role.
“The moment a species crosses from vagrant to regular is not marked by a single checklist. It is a threshold. When the frequency of reports stabilizes above zero for three consecutive years, you can start calling it a pattern.” — Dr. Amanda Renner, eBird project leader for the Western Flyway.
This kind of analysis also helps with conservation planning. If a species is becoming regular in a new area, land managers can prepare. They can monitor for nesting, adjust habitat management, and alert local birders.
A Practical Checklist for Your Own Analysis
If you want to run this analysis for your local patch, here is a straightforward workflow.
- Choose a species that is rare in your county or state.
- Set the date range to the last ten years.
- Pull the “Frequency” chart from eBird’s Explore Data page.
- Note the year when the frequency first exceeded 0.5 reports per 100 checklists.
- Check if that frequency held or increased in the following years.
- Look at the “Locations” map to see if the sightings are clustered or dispersed.
- Cross-reference with the species’ global range map to see if the new location is within a plausible expansion zone.
This process works for any species. You can apply it to the 5 Unexpected Vagrant Species That Showed Up in California This Year or to the Great Gray Owl Irruption that moved across the West last winter.
The Tools That Make It Possible
eBird provides several tools that make this analysis accessible.
- Explore Data: The main portal for species frequency, abundance, and range maps.
- Bar Charts: Show the number of checklists and the frequency of sightings over time.
- Range Maps: Animated maps that show how a species’ distribution changes month by month.
- Alerts: You can set up Rare Bird Alerts to get notified when a rare species is reported near you.
These tools turn raw data into a story. You can watch a species move from “rare” to “uncommon” to “regular” in real time.
Understanding the Limits of the Data
No dataset is perfect. eBird data has some known biases. Birders tend to submit more checklists on weekends and during migration. Some species are easier to identify than others. A rare sparrow might go unnoticed while a rare gull gets photographed and reported.
But the strength of eBird is its size. With millions of checklists submitted each year, the signal usually overpowers the noise. When you see a consistent upward trend across multiple years and multiple observers, you can trust it.
For a deeper look at what defines rarity in the first place, read our guide on What Makes a Bird ‘Rare’ in Western North America. It explains the criteria that eBird uses to classify species and how those classifications change.
The Moment of Transition
There is a specific moment in the data when a rare bird becomes a regular. It is not dramatic. It looks like a line on a graph crossing a threshold. In 2022, the species appears in 0.2 percent of checklists. In 2023, it is 0.4 percent. In 2024, it jumps to 1.2 percent. In 2025, it holds at 1.5 percent. In 2026, it is up to 2.0 percent.
That is the moment. The bird is no longer a vagrant. It is establishing a foothold.
You can see this happening right now with species like the Rufous-capped Warbler in Arizona. The Tracking the 2026 Rufous-capped Warbler Invasion in Arizona page shows the raw data. The frequency charts tell the story better than any field guide.
What This Means for Your Next Birding Trip
Knowing which species are becoming regular in your area changes how you bird. You can target those species with confidence. You can also contribute to the dataset by submitting your own checklists. Every checklist you add helps refine the picture.
If you are planning a trip to chase rarities, check the eBird data first. Look at the frequency trends for the past three years. If a species is on the rise, you have a better chance of finding it. Our guide on Chasing Rarities: Essential Gear Every Serious Birder Needs will help you prepare for the field.
Using the Data to Support Conservation
When a rare bird becomes a regular, it often signals a larger ecological shift. Climate change, habitat loss, and food availability all play a role. Conservation groups use eBird data to decide where to focus their efforts. If a species is moving into a new area, that area might need protection.
You can help by documenting your sightings carefully. Follow the best practices in How to Document and Report Your Rare Bird Sighting Like a Pro. Good data leads to good decisions.
The Future of Rare Bird Tracking
eBird continues to improve its tools. In 2026, the platform added real-time frequency updates for rare species. You can now see a species’ status change within days of a new sighting. This makes it easier to catch the moment of transition.
Machine learning models are also being trained on eBird data to predict future range expansions. These models can identify species that are likely to become regular in a region before the data confirms it. That is the next frontier.
But for now, the best tool is your own curiosity. Open eBird. Pick a rare bird. Run the numbers. See if you can spot the moment it crossed the line from visitor to resident.
Putting the Analysis into Practice
The next time you hear about a rare bird in your area, do not just grab your binoculars. Open eBird first. Look at the frequency data. See if this is a one-off or part of a trend. That knowledge will make you a better birder and a better citizen scientist.
The data is free. The tools are easy to use. And the story is always changing. Go find it.