You’re standing at your favorite patch when a flash of pink and gray lands on a bare branch. It’s a Common Redpoll, and you haven’t seen one in three years. Half an hour later, a Pine Grosbeak joins the show. Your phone buzzes with a rare bird alert: Evening Grosbeaks are swarming feeders fifty miles south. This is an irruption, and you just walked into the middle of it.
The question is: how did you get there at the right time? The answer lies in the sky. Not just the birds, but the weather systems that push them your way. Learning bird irruption prediction using weather patterns can turn that lucky coincidence into a repeatable skill. In this guide, you’ll get the methods field ornithologists use, the data sources that work in 2026, and the warning signs that tell you when to grab your bins and go.
Bird irruption prediction relies on reading specific weather triggers: large-scale atmospheric patterns that push northern seed-eaters south, storm systems that displace seabirds inland, and prolonged cold that exhausts food supplies. By monitoring 500 mb charts, sea-level pressure maps, and wind trajectory forecasts, you can anticipate irruptions one to three weeks in advance. Combine this with feeder reports and eBird data for real-time confirmation.
What Makes an Irruption Different from Migration
Regular migration is a seasonal clock. Birds go south in fall, come back in spring. Irruptions are chaos with a cause. They happen when a species that normally stays in the boreal forest or Arctic suddenly floods south in numbers that break records. Think Red Crossbills showing up on the California coast, or Snowy Owls lining the shore of Lake Ontario.
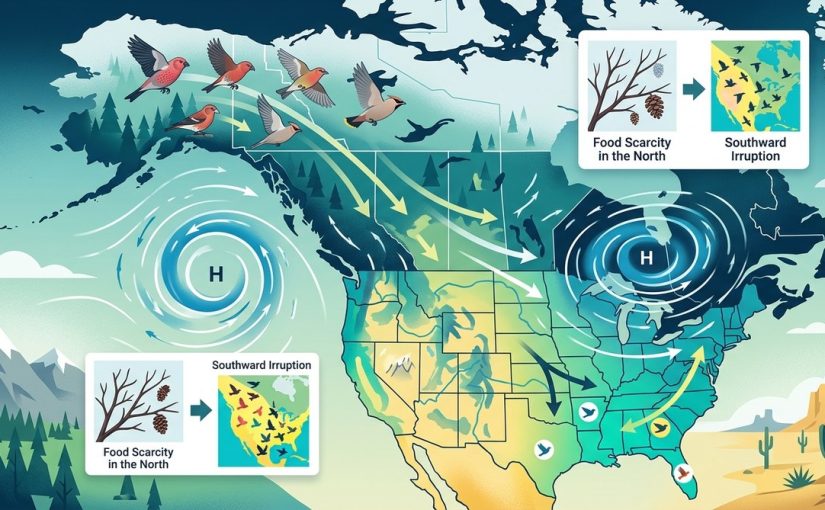
The primary driver is food scarcity. When cone crops fail or rodent populations crash, birds must move to survive. But the direction they move, the timing of their arrival, and the places they stop are all shaped by weather. A Pine Siskin could stay in one valley all winter if the food holds, but a strong low-pressure system coming out of Canada can scoop up a flock and drop them four hundred miles south in one flight.
Understanding this connection is the heart of bird irruption prediction. You are not trying to guess where a bird will go. You are learning to read the atmospheric conditions that push them there.
The Weather Connection: Why Patterns Matter
Weather acts as both a trigger and a transporter. The trigger is often a failure of natural food in the north, but the transporter is the wind. Here are the three most important weather patterns to watch for irruption forecasting:
- Blocking high pressure over northern latitudes (a “Greenland Block” or a persistent ridge over Alaska) that forces birds to detour around it, often steering them far south of their normal range.
- Deep troughs and cold fronts sweeping south from Canada. These push cold air and birds together. When the temperature drops twenty degrees in a day, birds that rely on exposed seeds or open water must move.
- Pacific storm systems that hook inland off the West Coast. These can drag seabirds like Sabine’s Gulls or Black-legged Kittiwakes hundreds of miles from the ocean. For a close look at that specific phenomenon, see our article on storm-driven seabirds when Pacific pelagics appear inland.
Each of these patterns leaves a signature on weather maps. Learning to spot them gives you a lead on where rare birds will show up.
How to Read Weather Maps for Irruption Forecasting
You don’t need a meteorology degree. You need a process. Here is a numbered list of steps you can follow each week during fall and winter.
-
Check the 500 mb height anomaly map. This shows the shape of the upper atmosphere. Look for a strong ridge over the Bering Sea or Hudson Bay paired with a trough diving into the central United States. That combo often forecasts an irruption of finches and crossbills two weeks later.
-
Identify sea-level pressure centers. A deep low (below 980 mb) over the Great Lakes or the Pacific Northwest can create transport winds that move birds rapidly. Note the position of the high behind it. The tight pressure gradient will produce gale-force winds that birds ride.
-
Plot backward wind trajectories. Use the HYSPLIT model or a similar tool to see where air parcels came from three to five days ago. If the trajectory originates in the boreal forest of central Canada or Siberia, any bird caught in that air mass could be carried to your region. This is especially useful for predicting vagrants like eastern warblers in the West. Our guide to eastern warblers in the West explains how wind patterns cause those overshoots.
-
Correlate with ground conditions. A cold snap alone is not enough if food is still available north. Check regional cone crop reports from the Winter Finch Forecast or the National Phenology Network. If seeds are scarce and a cold front is forecast, you have a one-two punch for an irruption.
-
Set eBird alerts for your county. When the first Pine Siskin shows up on a feeder watch, you know the leading edge has arrived. This is your confirmation that the weather window worked. For the best tools to track these alerts in real time, check out rare bird alerts: which apps and resources actually work best.
Tools and Data Sources You Need
The following resources will make your bird irruption prediction much more accurate.
- NOAA’s Weather Prediction Center for 500 mb and surface pressure maps.
- HYSPLIT trajectory model (free online) to compute backward air histories.
- Birdcast for real-time migration intensity and direction.
- eBird’s Explore Species to see historical irruption years for target species.
- Winter Finch Forecast (published annually by a network of banders).
- Local rare bird Facebook groups and WhatsApp chats for ground truth from other birders.
“The best irruption forecasters I know spend more time studying weather maps than field guides. They understand that a bird can’t fight a 40 mph headwind. The wind wins every time. If you learn to predict where the wind is taking the food, you’ll predict where the birds are going.” — Sam H., veteran birder and weather analyst from Minnesota.
Common Mistakes to Avoid When Predicting Irruptions
Even experienced birders fall into these traps. The table below shows errors and how to fix them.
| Mistake | Why It Hurts | Better Approach |
|---|---|---|
| Only watching surface temperature | Cold alone does not push birds south if food is available | Always check upper-level wind patterns (500 mb) |
| Ignoring the timing of food failures | Cone crops crash in late summer; irruptions follow in November | Cross-reference with boreal seed surveys |
| Relying on one data source | Weather models can be wrong; eBird can be slow | Combine at least three sources (model, trajectory, ground reports) |
| Forgetting about habitat on the ground | Birds land where there is shelter and food, not just wind | Pre-scout locations with conifers, weedy fields, or open water |
| Expecting irruptions every year | Even with perfect conditions, some years the birds just stay north | Be patient and accept that prediction is probabilistic not certain |
For example, many birders thought the winter of 2025-2026 would bring a massive Snowy Owl irruption based on high lemming numbers the previous summer. But the fall winds were predominantly westerly, keeping the owls on the tundra. In contrast, 2026 is shaping up differently, and you can follow the latest rare sightings on our page about tracking Western North America’s most recent rare bird sightings in 2026.
Applying the Method: A Walkthrough for Fall 2026
Let’s say it is late October 2026. You pull up the 500 mb map and see a strong ridge over Alaska and a trough digging into the Pacific Northwest. The sea-level pressure shows a 984 mb low off the coast of Vancouver Island with a trailing cold front. You run a backward trajectory from your location in western Oregon. It shows air arriving from interior British Columbia, where the pine cone crop has been reported as poor.
Your alert goes off: a friend reports three Red Crossbills at a feeder in Eugene. You know this is the leading edge. Within a week, Pine Siskins and Evening Grosbeaks follow. You head to a known spot with mature pines and find a flock of forty crossbills.
That is not luck. That is bird irruption prediction in action.
Building Your Forecast Routine
To make this a habit, set aside fifteen minutes every Sunday evening from September through March. Open a browser with bookmarked weather sites. Run through the five steps. Write down three predictions: one for the next week, one for two weeks out, and one for the region. Compare your predictions to what actually appears. You will get better with each season.
If you find a truly unusual bird, make sure your sighting counts. Learn how to document and report it properly by reading how to document and report your rare bird sighting like a pro. Every submission adds to the dataset that helps predict the next irruption.
Why 2026 Offers New Opportunities
Advances in weather modeling and citizen science mean that prediction accuracy is higher now than ever before. High-resolution ensemble forecasts can give you confidence windows up to ten days out. And networks like eBird have trained models that predict vagrant occurrence based on weather. You can even set up automated alerts for your specific target species.
For a look at some of the most exciting rarities already found this year, check out 5 unexpected vagrant species that showed up in California this year. And if you want to understand the criteria that make a bird “rare” enough to trigger an alert, read what makes a bird ‘rare’ in Western North America.
Your Next Steps for Smarter Birding
Bird irruption prediction is not a secret club. It is a repeatable skill that any birder can learn. Start with the weather maps. Practice the five-step routine. Trust the process, not the hype. When the next big irruption rolls south, you will be the one who made the call before the rest of the birding world caught on.
Grab a notebook, bookmark the models, and keep your feeders full. The next major irruption could be just one cold front away.